


Your data tells a story. We’ll help you see it clearly.

By ordering certified dashboard development services from us, you can obtain the full capacity of your data with the power of a bespoke solution tailored to your specific requirements. Our team of experts specializes in delivering top-notch software solutions that optimize monitoring, processing, and organizing essential business indicators. We will eagerly implement an intuitive Python dashboard, which will deliver a clear view of your company’s details in real time and assist in identifying trends and opportunities to accelerate growth and achieve success.
CUSTOM SOLUTIONS TO MEET YOUR NEED
Our Services
PLANEKS team will eagerly provide you with unlimited data representation forms, such as graphs, charts, and tables, which transform your raw data into comprehensive details for informed, smart decisions. Dashboard applications are the best way to make the most out of your business-generated data, as you can monitor, track, and analyze key metrics related to your company’s operations.
We are an offshore dashboard development company with experienced programmers and wide expertise.
JOB SUCCESS RATE
RAISED BY OUR CLIENTS
ONLY BY OUR CLIENTS
How you can benefit from custom dashboards
Benefits of Custom Dashboards
Customized Visual Insights
Easy Performance Monitoring
Detailed Reports
Facilitated Decision-Making Process
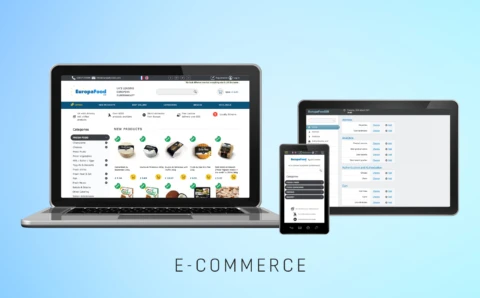
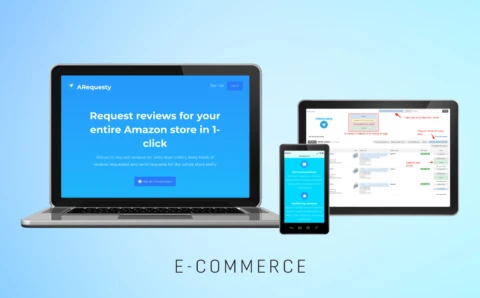
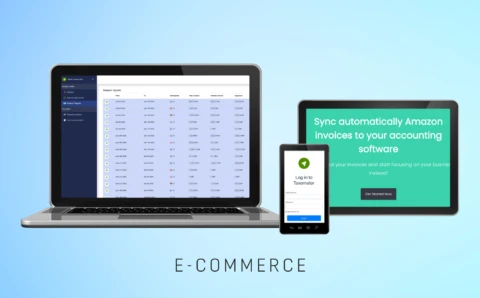
CASE STUDIES
Proud projects make us excel
Broaden your business opportunities with a dashboard app
Our Tech Stack
With Python, Django, and Flask we form the backbone of the dashboard software, making use of the required framework for handling and processing data. Django and Flask frameworks can be applied to design the core system. One of the valuable benefits of Django is the built-in admin panel. It ensures a model-centric interface with which you can manage content on your platform.
Tell us more about your project
Outsource professional dashboard development with the PLANEKS agency!
Testimonials
What do people praise about PLANEKS?
Transform your data into all-around comprehensive insights with a range of real-time dashboard app development services from PLANEKS. We understand how valuable it is for every business to have a solution that meets all business requirements. So each of your requirements and demands will be implemented in the smoothest way. Our Agile-oriented team of IT professionals will work with you closely to implement a high-end dashboard that fits your specific needs and drives better business outcomes. Take control of your data and renovate your decision-making process today.

Andras Marozsi
Finding competent automation engineers who produce a high quality code was very challenging, most other candidates just automatically started to add timeouts when they faced an issue. Candidates who PLANEKS offered had a much more mature approach, started with understanding the challenge and then provide a proper solution. I am happy to refer PLANEKS to any friend who needs reliable contractors.

Gabriel Yarra
Results were exactly what I wanted. PLANEKS was very flexible and able to quickly accommodate many requests. The fulfilled all phases of the project, and the result was a working application. Clear communication with no miscommunications or confusion. Professionals. Easy to work with!

Antoine Falisse
I am happy with PLANEKS’ services. The team’s project management is great, and their resources always meet deadlines. Communication is great too. I feel they’re a part of my team and really care about the project. Overall, the partnership has been truly successful.
Anonymous (Financial App)
What we found most impressive about PLANEKS was their exceptional ability to seamlessly integrate complex financial and technical components, delivering a user-friendly solution that met our needs effectively. Their dedication to both project management and customer service set them apart, ensuring that every aspect of our collaboration, from development to issue resolution, was handled with the utmost professionalism and responsiveness. This combination of technical prowess and exceptional service made them a unique and outstanding partner.

Marissa Huggins
PLANEKS did deliver projects on time and we are extremely happy with our services to-date. Not only has Anton been extremely kind in helping us navigate many time zones and work cultures, the engineers assigned have always been extremely professional and complete their work relatively as requested and on time. This is the most thorough and considerate engineering team we have ever outsourced by far. While there are still some gaps around communication and expectations for deliverables,this has been our best experience with offshore work yet.

Turi Mercuri
PLANEKS was ahead of schedule and built far more advanced than expected! What did I find most impressive or unique about this company? Professionalism, efficiency, clear communication and willingness to think outside the box to complete the tasks within fewer hours and at a higher standard than expected!! I will be working with PLANEKS for any future software development.

James Plowright
They meet their customer promises and communicate well. Anton is a great project manager and communicator, as a non-tech product owner I’ve found that he’s played an integral role in filling in the gaps to ensure there’s product design and technology alignment. We are due to launch soon and excited to start collecting feedback!

Daniel Smith
The projects have been completed on time and within budget. PLANEKS made sure that everything goes smoothly. Communication is excellent. They are happy to integrate with our existing tools and processes to communicate on projects. Furthermore, PLANEKS are open and honest about their capacity and capabilities.

Chloe Dagenais-Mignault
Our app needs quite specific knowledge and there is a big learning-curve, to which they have adapted quickly. Every deliverable has been finished in time and with great quality. All expectations were met and beyond. We really like PLANEKS’s teamwork and ability to understand complex business problems, business logic and how to efficiently address those problems in our code.
5.0/5.0
Blogs & news
Interesting articles updated weekly

CRM API Integration: The Complete Guide
As a business entrepreneur, your customer relationship management software (CRM) is a data hub that assembles and stores data across the entire …

What Are the Best APIs for eCommerce?
This guide explains the essential eCommerce APIs every modern store depends on. APIs can significantly ease that team pressure. …
