
Business Intelligence (BI) is an excellent technology for forward-thinking entrepreneurs who strive to achieve strategic decision-making, enhanced operational efficiency, risk management, and deep analysis. In a nutshell, BI refers to the processes, technologies, and tools used to extract, integrate, examine, and present business data. This technology caters to enhanced business decision-making and helps you build a reliable business strategy that will make your company succeed. The market size for business intelligence and analytics software applications is expected to grow globally from $15.3 billion dollars in 2021 to over $18 billion by 2026. This market is part of the larger enterprise application software market, which has global revenues of $212 billion and global revenues amounting to 212 billion U.S. dollars, as Statista claims.
BI-powered dashboards have become indispensable tools for businesses that aim to make informed decisions quickly and efficiently. By converting raw data into visually intuitive insights, these dashboards help stakeholders track performance, identify trends, and handle arising challenges in real-time.
What are the best practices for designing and using BI dashboards effectively to ensure they deliver maximum value to your organization? Let us introduce some guidelines that will help you create dashboards that are not only aesthetically pleasing but also highly functional.
This post will cover critical aspects of successful BI dashboard development, such as selecting relevant KPIs, ensuring data accuracy, designing for clarity, enabling user customization, and leveraging interactivity to enhance the decision-making process. By following these best practices, you’ll be well-equipped to make use of the full potential of your BI dashboards.
Table of Contents:
Understand Your Audience
Your audience’s distinguishing requirements are the starting point. Based on these, you can design BI dashboards that are highly functional, providing better decision-making and a data-driven culture within the organization.
Identify Stakeholders
The first step in creating an effective BI dashboard is outlining who will be using it. Different stakeholders have specific needs and priorities when it comes to data visualization and insights. For instance, executives typically require high-level overviews with key performance indicators (KPIs) included that ensure a snapshot of the organization’s overall health. They need dashboards that are quick to interpret and highlight critical areas that need attention. At the same time, managers often work with more in-depth views that allow them to track and manage the performance of their teams and departments. This position may require trend analysis, detailed breakdowns, and the ability to drill down into particular metrics to identify any issues comprehensively. Analysts need even more granular data, with the ability to perform complex queries and cross-reference various datasets to discover deeper insights.
User-Centric Design
Considering the previous point, it is highly useful to tailor the dashboards to meet these specific user requirements and preferences. A user-centric design approach ensures that the dashboard is intuitive and relevant for each user group that will be employing the BI software. In practice, for executives, this might mean concise, clean visuals with strategic KPIs front and center. In the case of managers, it could engage interactive elements that allow for real-time data manipulation and scenario analysis. For analysts, delivering advanced filtering options and access to raw data might be essential.
Define Clear Objectives
Setting clear objectives helps you find the right development direction when opting for dashboard development services. Before diving into the design and data integration, you should precisely describe the goals you want to achieve with your dashboard. Clear objectives will serve as a great guide and ensure that the dashboard aligns with the strategic goals of the organization.
Goal setting
Begin by identifying the specific business problems or opportunities your dashboard is intended to address. Are you aiming to monitor sales performance, track operational efficiency, or understand customer behavior? Well-established and precise goals help narrow down the focus and avoid the inclusion of irrelevant, excessive data that can clutter the dashboard and distract users from key insights.
KPIs and metrics
Once the objectives are set, the next step is to select the right Key Performance Indicators (KPIs) and metrics that cater to your goals. KPIs are quantifiable measures that represent an organization’s critical success factors. For example, if your main objective is to elevate customer satisfaction, relevant KPIs in this case may be Net Promoter Score (NPS), customer retention rates, and average response time. Considering another case, for the Human Resources (HR) dashboard, relevant KPIs are employee turnover rate, average time to hire, and employee satisfaction scores, which provide actionable insights to improve recruitment processes and overall workforce engagement. Having the appropriate metrics selected is vital because they provide the actionable insights needed to track progress and drive decision-making.
Your objectives should essentially align with the right KPIs and metrics to ensure that your BI dashboard serves its purpose effectively, delivering valuable insights that support informed decision-making and strategic planning.
Keep It Simple and Intuitive
Creating a BI dashboard that is fully-fledged and intuitive at the same time is essential for ensuring that users can easily extract deep insights without being frustrated by the functionality of your BI software.
Avoid clutter
Simplicity is one of the most fundamental principles in business intelligence best practices for dashboard design. Avoid overcrowding your dashboard with too much information or too many visual elements. Cluttered dashboards can confuse users and detract from the key messages you want to convey. Focus on displaying only the most relevant data and use white space strategically to highlight core details. Emphasize clarity and conciseness, making sure each element serves a clear purpose.
Easy navigation
An intuitive dashboard is one where users can effortlessly find the information they require. Ensure that your dashboard has a logical flow, with related information grouped together. Use clear labels, headings, and tooltips to guide users through the data. Interactive elements like drop-down menus, filters, and drill-down capabilities can be useful here, enhancing navigation by allowing users to explore data at different levels of detail without cluttering the main view.
Consistent layouts
Maintaining a uniform design throughout the dashboard is a practice that facilitates a cohesive user experience. Consistency in fonts, colors, and visual elements such as charts and graphs helps users quickly grasp and interpret data. Use design composition that will help users easily differentiate between data categories and maintain uniform chart styles to make comparisons easier. A structured layout not only elevates usability for all engaged parties but also enhances the aesthetic appeal of the dashboard.
By keeping your BI dashboard simple, intuitive, and seamlessly designed, you can ensure that users can focus on the insights that matter most, leading to more informed and effective decision-making.
Use Appropriate Data Visualizations
Selecting the right data visualizations determines how effectively the insights will be conveyed in your BI dashboard. The visual representation of data can significantly impact how users comprehend and interact with the information presented. Let’s go through some best BI dashboard design practices.
Chart types
The first aspect is selecting the appropriate chart type for your data. Different chart types serve distinct purposes:
-
- Bar charts. Perfect for comparing discrete categories or showing changes over time when the data points are few;
- Line graphs. Best for displaying trends over time, mainly when dealing with continuous data;
- Pie charts. Useful for showing proportions and percentages, though they should be used sparingly due to their limited capacity for displaying detailed comparisons;
- Scatter plots. Great for identifying correlations and patterns between two variables;
- Heatmaps. Effective for visualizing data density and variations across multiple indicators.
Need Help Bringing Your Dashboards to Life?
Leverage our experience in dashboard design and development to unlock the full potential of your data.
Visualization principles
Let’s dive into some best practices in data visualization that ensure that your charts showcase information clearly and efficiently:
-
- Use color when needed. Employ the power colors to differentiate data series but avoid overusing them. Stick to a consistent color scheme and use contrasting colors to highlight key data points;
- Labeling. Make sure all axes, indicators, and data points are clearly labeled. We highly suggest using straightforward, descriptive titles as well;
- Avoid distortion. Maintain accurate scaling and avoid manipulating axes in ways that can mislead users. Ensure your visualizations present data honestly and transparently.
- Keep it simple. Avoid unnecessary design decorations that can distract from the data. Adopt a simple, clean User Interface (UI) and User Experience (UX) that focus on the essential information.
With these best practices for dashboard design, you can implement suitable chart types and adhere to clean visualization principles. This helps create BI software that effectively communicates key analytics, facilitates understanding, and supports your business strategy.
Ensure Data Accuracy and Timeliness
For BI dashboards to be truly effective, the data they display must be accurate and up-to-date. Ensuring data quality and timeliness is critical to providing reliable insights that can guide decision-making.
Data quality
Accurate, complete, and reliable data is the foundation of a useful BI dashboard. Implement robust data validation and cleansing processes to remove inconsistencies, errors, and duplicate entries. Ensure that data sources are credible and data collection methods are standardized. Regularly audit and update data to maintain its integrity. Precise data ensures that the insights derived from your dashboard are trustworthy and actionable, reducing the risk of making decisions based on flawed information.
Real-time updates
Modern dynamic business conditions necessitate having access to real-time or regularly updated data. Dashboards that reflect the most current information enable you to respond swiftly to occurring trends, obstacles, and opportunities. Implement automated data refresh processes to ensure that your dashboard always displays the latest data. In case it’s real-time streaming data or periodic updates, the regularity of data refresh should adhere to the decision-making needs of the users. For instance, sales dashboards may require hourly updates, while the choice for optimal performance of strategic planning dashboards could be daily or weekly updates.
Data accuracy and timely updates are vital practices for creating BI dashboards that represent relevant and reliable insights. These aspects should essentially be considered, so you can enhance the credibility and utility of your dashboards, enabling more informed and effective decision-making.
Make it Interactive
Interactive elements significantly enhance the usability and effectiveness of BI dashboards by allowing users to engage with the data more deeply and intuitively. Interactivity enables users to customize their views, explore detailed insights, and uncover patterns that static dashboards might miss.
Filters and drill-downs
Providing filters and drill-down capabilities to allow users to focus on specific data subsets and explore underlying details. Filters allow users to dynamically adjust the data displayed based on criteria such as time periods, geographic regions, or product categories. Drill-down features enable users to start with a high-level overview and then click through to more granular levels of data, such as moving from a yearly sales summary to monthly or daily figures. These interactive tools empower users to perform customized analyses and gain a deeper view of the data.
Interactive elements
Interactive elements like hover-over details and clickable links can further enhance the user experience and efficiency of your BI software. Hover-over details provide additional context and insights without cluttering the main dashboard view. For example, hovering over a data point on a chart can display precise values, percentage changes, or explanatory notes. Clickable links can direct users to related reporting, external data sources, or detailed documentation, providing a seamless way to access more information.
Interactivity is one of the best practices for dashboard design, making it more flexible and user-friendly. Users should be able to filter, drill down, and interact with data. This creates a more engaging and informative roadmap that facilitates all-around insights and more informed decision-making.
Prioritize Performance and Speed
The performance and speed of a BI dashboard directly impact efficiency, user experience, and productivity brought by your BI software. A slow or unresponsive dashboard can hinder users from wise decision-making processes, making it essential to prioritize optimization and regular testing.
Optimization
Implement various optimization techniques to ensure your dashboard loads quickly and performs well. For this, simplify data queries by cutting down the number of data sources and minimizing complex calculations. Employ indexing and caching strategies to speed up data retrieval processes. Streamline visualizations by limiting the use of heavy graphics and large datasets that can slow down the rendering process. Besides, consider implementing data aggregation techniques, where summary data is pre-calculated and stored so that the need for real-time calculations is eliminated.
Testing
Frequent testing is a reliable way to maintain optimal performance across different devices and browsers. Test your dashboard on various platforms to identify and troubleshoot any performance failures, issues, and other drawbacks. Use performance monitoring tools to track load times, response times, and resource usage. Conduct stress tests to guarantee the dashboard can handle high volumes of data and multiple users simultaneously without degradation in performance. Continuously monitor user feedback to identify any performance bottlenecks and address them as soon as they arise.
Prioritizing performance and speed through effective optimization and regular testing helps ensure that your BI dashboard remains effective, responsive, and user-friendly. By maintaining a high-performing dashboard, you ensure that your software has a longer lifecycle and that users are provided with a seamless experience that supports efficient data analysis. An excellent, error-free performance can also be achieved by building the BI software with a reliable tech stack. To do this, you should dive deeper into how to develop a dashboard app with Python.
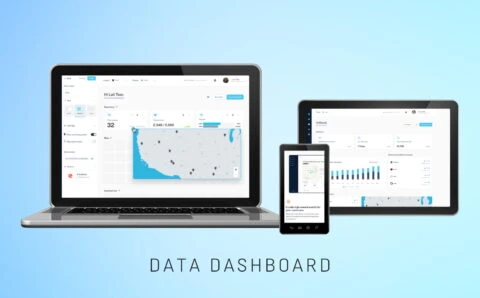
Spontivly
We optimized Spontivly with 120 integrations, improving data dashboards & performance for more than 70 organizations, making operations smoother.

Spark
With Spark, fleet managers get transparency on fuel use, identify inefficiencies, and drive change through real-time energy efficiency rankings.
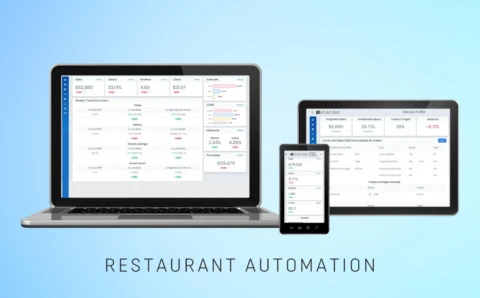
Restaurant Management
We created a cloud-based platform integrating restaurant data sets, offering advanced forecasting, reporting tools to drive profitability and efficiency.
Provide Context and Insights
A BI dashboard’s value is significantly enhanced when it provides context and insights that help users quickly grasp the underlying trends and anomalies. Therefore, adding explanatory elements and employing data storytelling techniques can make your dashboards more informative and actionable.
Annotations and comments
Incorporating annotations and comments directly on your dashboard can clarify data points, highlight significant trends, and explain anomalies. Annotations might comprise brief notes on sudden sales spikes, seasonal patterns, or unexpected dips in performance. To illustrate, a sudden growth in web traffic might be annotated with a note about a successful marketing campaign. Comments, in turn, can also guide users on how to interpret complex charts or metrics, providing context that might not be immediately apparent from the data alone. These explanatory elements help users quickly grasp the significance of the data and understand the factors driving changes.
Storytelling with data
Effective dashboards go beyond merely displaying numbers; they tell a complete story. A well-structured dashboard can guide users through a logical flow of information, creating the full narrative. Start with high-level overviews that provide a broad context, then allow users to drill down into more detailed views. Use a combination of visual elements, such as charts and graphs, along with textual explanations to guide users through the data. Highlight key findings, trends, and insights that align with the business objectives. A well-told data story not only informs but also engages users, making the insights more memorable and impactful.
Providing context and insights through annotations, comments, and storytelling transforms your BI dashboard from a data-display-only into a robust tool for presenting, describing, and decision-making. This approach helps data analysts quickly grasp the meaning behind the data, leading to more informed and effective actions.
Regularly Review and Update
To ensure your BI dashboard remains effective and relevant, it is essential to establish a process for regular review and updates. This ongoing maintenance helps you adapt to changing business needs and continuously improve the user experience.
Feedback loop
Ask your users to provide feedback on the dashboard’s functionality, design, and data relevance. Implement practices such as surveys, feedback forms, or regular meetings to gather user opinions and reviews. The feedback can highlight areas where the dashboard excels and identify pain points or gaps in the data presentation. Actively engaging users in the improvement process ensures that the dashboard evolves in line with their needs and expectations, ultimately enhancing its utility and effectiveness.
Ongoing maintenance
Regularly update the dashboard to reflect the latest business priorities, data sources, and technological advancements. This may relate to implementing new data sets, removing obsolete information, and incorporating new KPIs as business goals redirect. Periodic checks will help you ensure that the dashboard’s design and functionality remain following the current needs of the organization. Moreover, staying updated with the latest best practices in data visualization and dashboard design can help you make informed enhancements. Schedule regular audits of the data and dashboard performance to identify any technical issues or inaccuracies that need to be addressed promptly.
An effective BI dashboard requires a commitment to regular review and updates. Strategies such as a feedback loop with users and ongoing maintenance can ensure that your dashboard remains a valuable tool for decision-making and adapts to your business’s changing conditions.
Ensure Security and Access Control
Security and access control are integral to any organization, especially for businesses operating in highly regulated sectors such as healthcare, finances, and banking. Solid security and access controls help secure the data within your software and ensure that your BI dashboards remain reliable and secure tools for decision-making.
Data security
Protecting sensitive data within a BI dashboard maintains the integrity and confidentiality of information. Robust security can be implemented by encrypting data both at rest and in transit to prevent unauthorized access and breaches. Adopt strict authentication measures, such as multi-factor authentication (MFA), further ensuring that only authorized users can access the dashboard. Regularly updating software and patching vulnerabilities is essential for you to prevent exploitation by malicious actors. Last but not least, you should guarantee compliance with data protection regulations such as GDPR, HIPAA, and CCPA. This aspect should be a priority for you, ensuring that sensitive data is handled lawfully and ethically with no violations.
User access levels
Implementing role-based access controls (RBAC) is a time-tested way of managing who can view or modify the BI dashboard on different levels and across various departments. RBAC allows administrators to assign permissions based on user roles so that individuals have access only to the data necessary for their role. This minimizes the risk of unauthorized data manipulation and enhances overall data security within the usage of diverse parties. For instance, executive dashboard best practices may require access to sensitive summaries, while analysts may access limited granular data. Reviewing and updating access levels as roles change within your business helps ensure access remains appropriate and secure.
Data security and user access levels are vital for safeguarding BI dashboards. Fundamental security features like encrypting data, implementing multi-factor authentication, and compliance with regulations protect sensitive information. Role-based access controls (RBAC) limit access to necessary data based on user roles, reducing the risk of unauthorized manipulation. Regular updates and reviews of security measures and access permissions ensure that BI dashboards remain secure and reliable tools that introduce colossal value to your business.
Conclusion
Adopting these 10 strategies is guaranteed to make your BI implementation successful. You create a user-friendly and effective dashboard by having a clear view of your audience, setting core objectives, and maintaining simplicity and data accuracy. Engage appropriate visualizations, interactivity, and performance optimization while providing context and taking care of security. Regular reviews and updates will keep your BI tools relevant and powerful, driving informed decision-making and business success.
Apply these best practices to your own BI dashboards to enhance security and ensure that your data-driven insights remain accurate and trustworthy. Keeping the best BI dashboard practices in mind, you can leverage intelligent tools to make informed, strategic decisions that make your business win the market.

