
A custom dashboard centralizes key metrics, improves reporting accuracy, speeds up decision making, and can be tailored to your exact workflows and data sources.
Data is one of the most valuable assets for businesses, as entrepreneurs can employ and interpret this valuable resource effectively to gain a significant competitive edge. According to Linearity, 68% of enterprises have boosted their investments in data visualization over the past two years, proving its considerable impact on business growth. Adopting modern data visualization tools, 72% of organizations can now access insights faster, sometimes even in real time.
Effective data visualization helps businesses grasp complex data and enables quick and informed decision-making. Custom dashboards, in particular, can turn raw data loads into seamless and comprehensive insights tailored to a business’s needs. They can provide a centralized, real-time view of critical metrics and performance indicators, facilitating a clearer view of business operations and trends. By enhancing data visibility and skyrocketing operational efficiency, bespoke dashboards are inalienable tools for businesses aiming to win the market.
In this article, we’ll cover the top five benefits of dashboards tailored to your specific requirements and how they can elevate your business operations.
Table of Contents:
What are custom dashboards?
Custom dashboards are interactive, tailored data visualization tools designed to meet specific business requirements. They are the absolute contrary to generic dashboards, which often provide a one-size-fits-all approach. Custom dashboards are implemented to demonstrate the most relevant data, integrate the necessary data sources, and deliver a highly personalized user experience. They serve as dedicated business assistants that track key performance indicators (KPIs) and metrics in real time, allowing quick insights and actionable decision-making. With a custom dashboard, you gain a hub that assembles data from multiple platforms. Thus, when ordering qualitative dashboard development services, businesses gain a unified view of workflows, enhancing both data accessibility and comprehensibility.
Custom dashboards vs. standard dashboards
Custom dashboards outweigh standard dashboards with significant values. Standard dashboards basically provide pre-built templates, providing insufficient flexibility. Bespoke dashboards can be fully tailored to specific business needs, incorporating outstanding data sources and metrics. They introduce maximum customization in terms of design and functionality, allowing entrepreneurs or departments to focus on the data that matters most. Besides, custom dashboards provide enhanced interactivity, scalability, and integration capabilities, so they stay highly adaptable and more relevant as business needs modify.
Custom vs. Standard dashboards
Examples of custom dashboards
-
- Marketing dashboards. They often track campaign performance, customer engagement, lead generation, and social media metrics, helping marketers optimize their strategies and measure return on investment (ROI).
- Sales dashboards. Such solutions offer insights into sales pipelines, revenue forecasts, win/loss rates, and customer acquisition costs, enabling sales teams to monitor progress and determine upcoming opportunities.
- Financial dashboards. These platforms deliver in-depth views of financial performance, including income statements, balance sheets, cash flow analysis, and budget tracking, which are essential for financial planning and analysis.
- Operational dashboards. Such dashboards show metrics related to production, supply chain, inventory, and quality control, aiding businesses in enhancing efficiency and cutting down operational costs.
Key benefits of custom dashboards
Custom dashboards deliver significant advantages in enhancing data comprehension and decision-making efficiency. Such software employs the brain’s ability to process visuals, taking even less than 13- 80 milliseconds (according to Springer Link), making complex data more comprehensible and actionable. According to Search Logistics, high-quality visualizations, such as infographics, are 30 times more likely to be read than plain text, providing core insights that are quickly and effectively communicated to users. Let’s dive into some more reasons you should implement dashboard software into your business flows:
Enhanced data visibility
One of the main benefits of using dashboards is the centralized data view. Custom dashboards are a fully-fledged platform where data from diverse sources is assembled and displayed cohesively. An absolute view liquidates the need to access multiple systems, making tracking key performance indicators (KPIs) and business metrics optimized for one place. It elevates data accessibility and offers a comprehensive snapshot of the organization’s performance, helping with informed decision-making.
With real-time data integration, custom dashboards allow for ongoing monitoring of business activities. This feature ensures that the newest data is always on hand so entrepreneurs can implement timely changes and measures respective to business, market, or operational conditions. Real-time updates facilitate highly efficient management, helping to identify trends and eliminate issues early.
Improved decision-making
Bespoke dashboards can be built to show the most relevant data for a specific business function or goal, enhancing decision-making. A targeted approach ensures that decision-makers have access to metrics that are directly important to their roles, allowing for more accurate and contextually appropriate decisions.
Detailed and up-to-date insights within made-to-order dashboards allow you to base your strategic decisions on practical data rather than personal conclusions or intuition. This will make your business decisions more accurate, support strategic planning, and help identify opportunities for growth and improvement.
Increased efficiency
Other dashboard benefits cover automating the process of gathering and compiling data from disparate sources, saving the time and effort dedicated to manually finding the necessary data, collecting it, and reporting it. Dashboards streamline workflows and save valuable time for more complex tasks, positively impacting business productivity.
Routine reporting tasks can be automated via custom dashboards, providing consistency and accuracy while eliminating the need for repetitive human interventions. Therefore, you reduce the potential for human faults and deliver timely access to reports, facilitating faster and more effective decision-making.
Customization and flexibility
The key benefits of dashboards in business are their customized approach and top-tier flexibility. They allow you to tailor the design and functionality to meet your requirements. This may relate to integrating some unique data sources, tracking particular KPIs, or adapting for specific workflows — custom dashboards can be configured to meet diverse business necessities.
As your organization keeps progressing, its data needs grow more complex in parallel. Bespoke dashboards can be scaled and adapted to cater to new requirements and increased data volumes. Scalability is critical, as it ensures that the dashboard remains relevant and useful as the business expands, providing a long-term solution that grows with the organization.
Better collaboration
Several team members can access custom dashboards, which streamlines collaboration and ensures that everyone has visibility into core metrics and performance indicators. Shared access helps align team efforts, enhance communication, and achieve a cohesive approach to obtaining business goals.
With role-based access controls, tailored dashboards provide solid security measures. Users see only the data relevant to their role, so data is shown relevantly and according to the team member’s responsibilities. This feature helps maintain data integrity and compliance with data protection regulations while restricting unauthorized access to sensitive information.
Uncover Our Dashboard Development Process
Learn how we meticulously design and develop custom dashboards that drive business growth and efficiency.
Case study
Spontivly is a case that clearly demonstrates the advantages of a custom dashboard development process for businesses. It defines how tailored software can effectively meet complex requirements and offer flexible and scalable solutions that drive business success. Let’s get acquainted with this robust platform.
Spontivly
Spontivly, designed by PLANEKS dedicated software engineers, is a dashboard software showcasing a fully-fledged dashboard solution. It makes data easily accessible, enabling users from various departments to create insightful and flexible dashboards without technical hassles.
Spontivly is a customizable dashboard platform that centralizes data from multiple sources, supports various chart types, and offers seamless integration with widely used tools. It delivers a user-friendly interface that non-tech users can easily navigate. Spontivly integrates with over 120 community tools, covering popular platforms like Slack, Zoom, and LinkedIn, to provide customizable and intuitive dashboards. It also has some advanced features like workspace separation and AI-generated chart themes.
PLANEKS developed a comprehensive dashboard system, implementing features like a drag-and-drop interface for easy customization, integration with a wide variety of platforms, and a chart-filtering constructor that supports various data visualization needs. We focused on creating an adaptable and efficient dashboard solution that enhances data management and provides actionable insights across diverse user necessities.
Our collaboration resulted in a powerful dashboard platform that facilitates data insights’ automation, generation, and effortless sharing. Spontivly’s clients now enjoy 50% faster automation workflows and can access over 1,000 data points, improving decision-making and aligning team objectives across 70+ companies.
How to create effective custom dashboards
How do you gain the complete list of pros of data dashboards? The proper and accurate software implementation guarantees your business will achieve the maximum value from such software. Here are some vital steps to follow to attain a high-performing custom dashboard:
Identify objectives
Start by defining the key metrics and goals that the dashboard should track. Identify the specific KPIs that align with your business objectives and ensure they provide actionable insights. Some relevant KPIs are sales growth, customer acquisition cost, and employee productivity. They provide valuable insights into business performance, enabling better decision-making and strategic planning.
Still, use the individual approach and investigate the relevant KPIs for your specific case. Custom BI dashboards can track specific industry-related metrics, ensuring a comprehensive overview of critical business areas.
Besides, it’s highly suggested that stakeholders from different departments be engaged to help gather a comprehensive list of requirements and create a single powerful dashboard that simultaneously meets a range of needs.
Choose the right tool
The proper data visualization tool depends on your project’s requirements and your team’s skills.
D3.js
D3.js, a powerful JavaScript library, is perfect for creating highly customizable and interactive visualizations by binding data to the Document Object Model (DOM). It is flexible and ensures solid control, ideal for complex visualizations. However, it requires significant coding skills and can be performance-intensive with large datasets.
amCharts
In contrast, amCharts offers a more user-friendly approach. This commercial JavaScript library is valued for its intuitive interface and rich feature set, so business applications and dashboards frequently adopt it. Nevertheless, while it simplifies the creation of interactive charts and maps, its licensing fees and limited customization compared to D3.js may be drawbacks.
Highcharts
Highcharts is another popular option, and it is applied due to its simplicity and efficiency. Its easy-to-use API and extensive compatibility across different platforms and browsers provide excellent project accessibility. Despite offering many templates and examples, Highcharts has fewer customization options than D3.js and incurs licensing costs for commercial use.
Follow the best design principles: tips for creating intuitive and user-friendly dashboards
Keep the design concise and bring out key data points. Avoid chaotic and incomprehensive data representation so that the most important information stands out clearly and can be easily grasped. Employ consistent colors and styles for clarity, or use your brand color palette if you have one; a seamless color scheme and consistent fonts will further help you read and comprehend data quickly and create a cohesive and appealing look.
Aside from that, interactive features can bring many dashboard benefits. Use filters to allow users to dive deeper into the specific information they seek. Interactive elements such as tooltips and drill-downs deliver additional insights without overloading the initial view. Ensure that the layout is clean, using whitespace effectively to avoid visual overload. Organize content logically to guide the user naturally through the dashboard.
We also suggest you demonstrate data distinctly to make important information easily accessible. Key metrics should be visible at first glance so users can grasp essential insights without frustration and enhance the overall user experience.
Implement continuous improvement: regular updates and feedback incorporation
Update the dashboard regularly to adhere to changing needs and consider user feedback. To this end, integrate new data sources, enhance visualizations, or make layout adjustments. Continuous improvement ensures that the dashboard remains relevant and valuable as your business evolves.
Challenges and solutions
Aside from the solid list of dashboard benefits, you should be aware of the challenges you may face on your development roadmap. Let us offer some BI dashboard best practices to help you optimize your development journey and obtain the maximum advantages from the output.
Data integration: handling multiple data sources
Challenge: Integrating data from various sources, such as CRM systems, financial databases, and third-party applications, can be a challenge due to differences in data formats and structures.
Solution: Employ data integration tools like ETL (Extract, Transform, Load) platforms or middleware to streamline the data consolidation process. Ensure that your chosen dashboard tool supports multiple data connectors for seamless integration. Set a data governance framework to standardize data formats and provide consistency across sources, helping combine and analyze data effectively.
User adoption: ensuring team members use and benefit from dashboards
Challenge: Even the best-designed dashboards can fall short if team members do not use them properly or understand their benefits.
Solution: Engage users in the dashboard design process to make sure it meets their needs and preferences. Provide comprehensive training sessions to demonstrate the dashboard’s functionality and its benefits. Create a user-friendly interface with intuitive navigation and relevant metrics to achieve regular use and avoid user frustration. Ensure a data-driven culture by showcasing the benefits of a dashboard to improve decision-making and operational efficiency.
Maintaining accuracy: keeping data clean and up-to-date
Challenge: It may be difficult to ensure that the data shown on dashboards is accurate and current, especially if data comes from multiple sources or is subject to frequent updates.
Solution: Implement automated data cleaning processes to determine and rectify errors, duplicates, and inconsistencies. Schedule regular data audits to maintain data integrity and update the dashboard in real-time or at scheduled intervals to reflect the most recent information. Adopt data validation rules to prevent incorrect data entry and integrate feedback mechanisms to address any discrepancies or inaccuracies identified by users faster.
Ready for Custom Dashboard Solutions?
Transform your data into actionable insights with our bespoke dashboard development services tailored to your business needs.
Future trends in custom dashboards
Cutting-edge technologies and dynamic user needs ensure innovations, enhancing data analysis and accessibility. By 2025, the global data visualization market is predicted to grow to $10.2 billion, up from $7.6 billion in 2021. As a forward-thinking entrepreneur, keep up with the recent market tendencies and implement the most relevant ones into your software. Here are some key future trends in custom dashboards:
AI and Machine Learning: predictive analytics and smart insights
Future custom dashboards can effectively adopt AI and machine learning algorithms to offer predictive analytics capabilities. Such technologies will investigate historical data patterns to project future trends and outcomes so businesses can make smarter decisions and anticipate market changes.
AI-driven custom dashboards will provide all-around insights by automatically identifying correlations, anomalies, and trends within data sets. Such a capability goes beyond mere reporting – it delivers more profound insights into customer behavior, operational efficiencies, and revenue forecasts.
Increased interactivity: more interactive and immersive dashboards
Future custom dashboards will emphasize enhanced interactivity to facilitate more engaging user experiences. Features such as dynamic filters, drill-down capabilities, and real-time data updates will enable users to intuitively manipulate and explore data sets. Interactive visualizations currently provide deeper insights into complex data relationships and will continue to do so in the future.
Mobile optimization: dashboards on-the-go for mobile devices
Users prefer to surf the Internet using their mobile devices. According to WebFX, 54% of all website traffic is generated from phones. Thus, future custom dashboards will prioritize mobile optimization. Responsive design principles will ensure that dashboards are accessible and functional across various screen sizes and devices.
Mobile-optimized dashboards gain popularity as they allow decision-makers to access critical business insights anytime and anywhere, enhancing flexibility and productivity. Features like push notifications and offline access will further improve convenience, allowing users to stay informed and make decisions on the go.
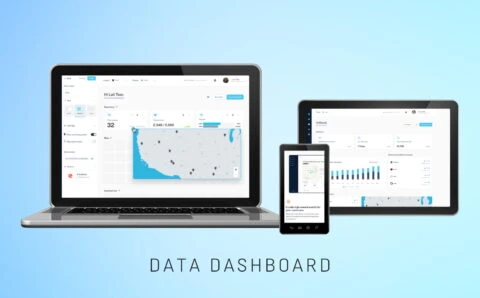
Spontivly
Spontivly empowers teams with data points and integrations, enhancing decision-making & efficiency across firms, streamlining processes.
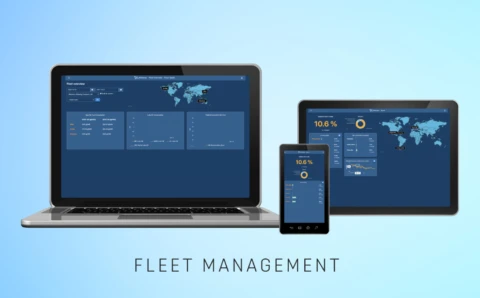
Spark
Spark provides fleet operators with detailed fuel analytics, fostering energy efficiency and cost savings through an intuitive mobile interface.
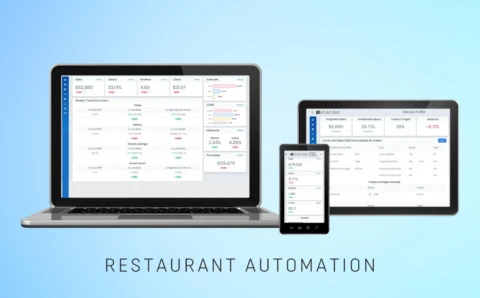
Restaurant Management
Built a cloud-based platform for restaurant management, consolidating data into a central dashboard to improve efficiency & drive profitability.
Conclusion
Considering everything, custom dashboards offer businesses a vast range of valuable benefits:
-
- Enhanced data visibility;
- Improved decision-making capabilities;
- Increased operational efficiency through automation;
- Flexibility to adapt to changing needs;
- Cohesive collaboration among team members.
Adopt the capacity of custom dashboards to turn your organization’s data into actionable insights. With custom dashboards, you can equip your departments across your team with real-time information, streamline operations, and make the most thoughtful decisions faster. We at PLANEKS are ready to help you take the next step towards optimizing performance and achieving business goals with personalized data visualization tools. Contact us today, and we’ll consult you on your specific case, helping you make the most of your custom dashboard.

